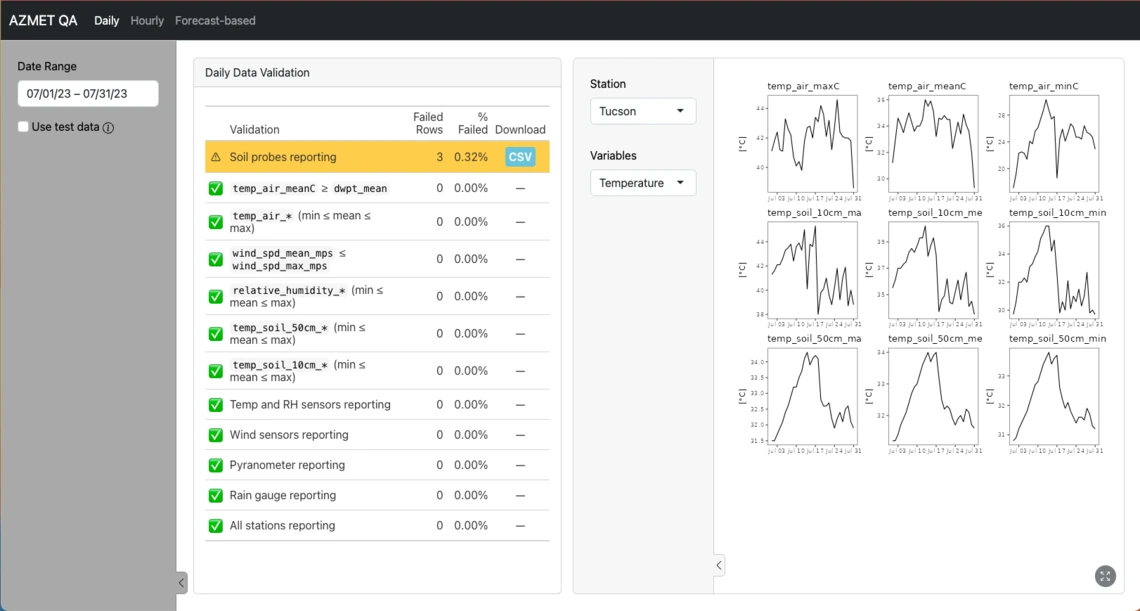
The Arizona Metrological Network (AZMet) provides meteorological data from a network of weather stations throughout Arizona. In addition to some simple range checks that were already in place, Jeremy asked us to create a dashboard with more in-depth data validations of these data. For example, to flag data when solar radiation is 0 for more than 14 hours or when air temperature is lower than the dewpoint. To do this, we created an R package, azmetr, to access the AZMet data API through R, then used that package to pull data on request in a Shiny app. In addition to the rule-based validations, we also experimented with some model prediction based validations. A timeseries model is fit to past data, then used to predict the current data point. If the observed data doesn't fall within a 99% predictive interval of the predicted data, the point is flagged for review.